
Vagrant + PhpStorm + Xdebug でブレークポイントを張って変数の状態をデバッグする方法を紹介します。Vagrant の synced_folder でソースコードを共有し、開発はホスト PC で、PHP 実行は仮想マシンで行っている方を対象としています。ホスト PC の PhpStorm でデバッグ実行ができるようになります。
ローカル PHP をデバッグする方法は以前書いた記事が参考になると思います。
PhpStorm+Xdebugでローカル環境のPHPをデバッグする方法
動作確認環境
- Mac OSX Mountain Lion
- PhpStorm7
目次
Vagrant 仮想マシンの Xdebug を有効化
Vagrant 仮想マシンの Xdebug を有効化します。php.ini(xdebug.ini) を以下のように設定します。
xdebug.remote_enable=1
xdebug.remote_autostart=1
xdebug.remote_host="192.168.33.1"
xdebug.remote_port=9000
xdebug.idekey="PHPSTORM"
xdebug.remote_host は仮想マシンから見たホスト PC の IP アドレスを設定します。$_SERVER['REMOTE_ADDR'] と同じ値にしておけば良いと思います。Vagrant 仮想マシンの IP アドレスによって適宜変更してください。
xdebug.remote_port はデフォルトが 9000 ですが、PHP-FPM のポート番号のデフォルトも 9000 なので、かぶらないようにしましょう。
Xdebug のポート番号を確認
PhpStorm の Xdebug ポート番号を確認します。仮想マシンの xdebug.remote_port と同じ数字にしておきます。
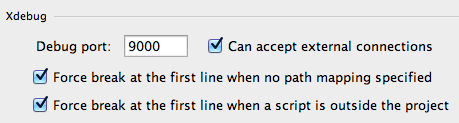
- PhpStorm の 設定ウィンドウを開き、Project Settings > PHP > Debug をクリック
- 必要に応じて Xdebug のポート番号を変更
Deployment を設定
仮想サーバに各種ファイルをデプロイする方法を設定します。仮想マシンの Xdebug の状態を PhpStorm から確認するために設定が必要です。
設定は過去に書いた記事と同じです。以下のリンクからご確認ください。
PhpStormでVagrant仮想マシンのPHPUnitを実行する # Deployment を設定
Xdebug 実行サーバの設定
Servers
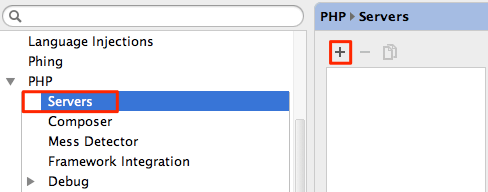
設定ウィンドウを開き、左メニューから Project Setting > PHP > Servers を選択します。「+」ボタンをクリックして新規追加します。
Xdebug 実行サーバを設定します。
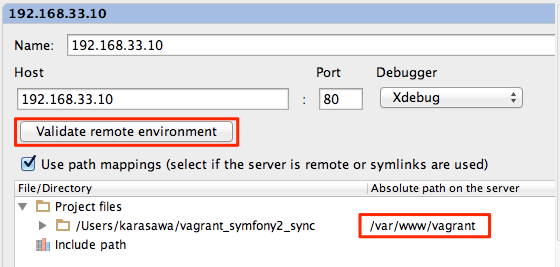
- Name は管理しやすい名前を入力
- Host は Vagrant 仮想マシンの IP アドレスを入力
- Port は PHP アプリケーションのポート番号を入力
- Debugger は Xdebug を選択
- Use path mappings にチェック
- File/Directoryで synced_folder で共有しているローカルのディレクトリを選択し、その右にある Absolute path on serverに仮想マシンの共有ディレクトリを入力
Validate remote environment
Servers 設定の Validate remote environment ボタンをクリックして、Vagrant 仮想マシンの Xdebug の状態を確認します。Xdebug に問題があるとここで警告してくれます。
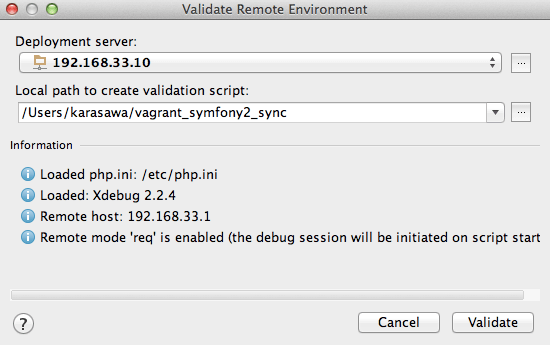
- Deployment は先ほど設定したデプロイ設定を選択
- Local path to create validation script は Vagrant の synced_folder のルートを選択
- Validate ボタンをクリック
PHP Remote Debug 設定
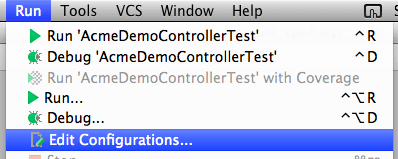
メニュー > Run > Edit Configurations を選択します。
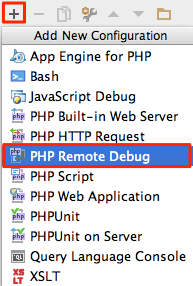
左上の「+」ボタンをクリックし、PHP Remote Debug を選択します。
PHP Remote Debug を設定します。
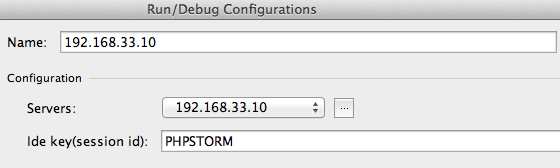
- Name は管理しやすい名前を入力
- Servers は Xdebug 実行サーバの設定で設定したサーバを選択
- Ide key は PHPSTORM と入力(php.ini の xdebug.idekey と同じ値に)
デバッグ実行
これまでの手順でデバッグの準備が整いました。ブレークポイントを張ってデバッグしてみましょう。
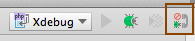
まず、PhpStorm をデバッグ待ち受け状態にします。
- 右上のプルダウンメニューから登録した Remote Debug を選択
- 電話機みたいなアイコン(Start Listen PHP Debug Connections)をクリック
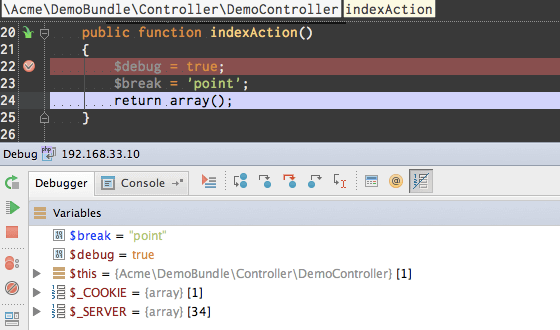
ソースコードにブレークポイントを張り、ブラウザからアクセスします。ブレークポイントの位置でプログラムの実行が止まります。
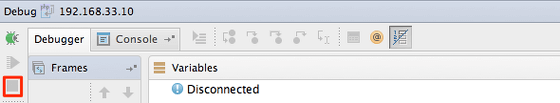
デバッグ実行を終了したい場合は「■(停止)」ボタンをクリックします。
テストを書いていればデバッガは不要になるはず
デバッガを起動するということは、そのコードの動きがよく分からないことを意味します。フレームワークなど、他人の書いたコード解析するためにデバッガを使うのは OK ですが、自分で書いたコードでデバッガを使うのは NG だと思います。デバッガに頼った開発をしている方は、今すぐデバッガを封印してテストを書く意識を持ちましょう。